
Qualified enquiries, retention and enquiry-to-booking conversion decide whether a healthcare video worked, not raw view counts. Separate paid views from organic ones before you judge anything. Tag every link with UTMs so enquiries trace back to the video that generated them, and ask any agency for retention curves alongside their view totals. If a monthly report leads with views, send it back.
TL;DR:
- Paid views and organic views must be reported separately, as paid reach does not predict organic engagement or inquiries.
- Retention curves and qualified inquiries are more indicative of video performance than raw view counts or impressions.
- On platforms like YouTube and Reels, metrics like watch time and completion rate matter more than reach or views for assessing engagement.
- Effective measurement relies on linking video metrics to actual patient inquiries, bookings, and CRM data through UTM tags and attribution.
- Content should be brief, with A/B testing focusing on thumbnails, hooks, and titles for better click-through and retention results.
Table of Contents
- What healthcare video metrics actually measure
- What matters on YouTube, Reels, Shorts and LinkedIn
- Why paid and organic views must be reported separately
- Realistic benchmarks by specialty and channel maturity
- What to demand in a monthly video performance report
- Privacy and compliance considerations for healthcare video
- Reading comments, shares and patient sentiment properly
- Connecting video metrics to acquisition and retention
- Running A/B tests on healthcare video content
- Where healthcare video metrics interpretation goes wrong
- How digital-first clinics should brief for measurable video
- How Com builds video you can actually measure
- Sources
What healthcare video metrics actually measure
Every metric tells you something different, and confusing them is how clinics end up celebrating numbers that mean nothing. Views are the loosest metric of all: platforms count a view after just a few seconds, so a high view count can hide a video nobody actually watched. Impressions measure how often a thumbnail appeared, not who clicked it. Click-through rate (CTR) measures thumbnail and title pull; view-through rate (VTR) measures how many people who saw an ad watched it to completion or near-completion.
Cost metrics matter for anyone running paid promotion. Cost per view (CPV) tells you what each view cost; healthcare campaigns commonly land near US$0.07 per view, with view-through rate benchmarks around typical sector medians. Treat both as directional. A specialist rehab clinic running a niche audience will see different numbers to a general practice targeting an entire suburb.
Retention is where the real diagnostic value sits. Average view duration gives you a single number; the retention curve shows you the shape behind it, second by second. A steep drop in the first ten seconds tells a completely different story to a slow bleed across the middle of the video, and each pattern calls for a different fix.
Engagement metrics round out the picture:
- Likes, comments and shares signal whether the content resonated enough for someone to act publicly, not just watch passively.
- Subscriber conversion per 1,000 organic views shows whether a video is building a durable audience or just passing through feeds.
- Cost per lead (CPL) or cost per acquisition (CPA) connects spend to genuine enquiries, calculated from ad platform data matched against your intake records.
- Enquiry-to-booking conversion is the number that answers the question a practice owner actually asks: did this video fill appointment slots?
Collecting the last two properly means combining platform exports with your customer relationship management (CRM) system or booking software, something healthcare video ROI tracking depends on getting right from day one.
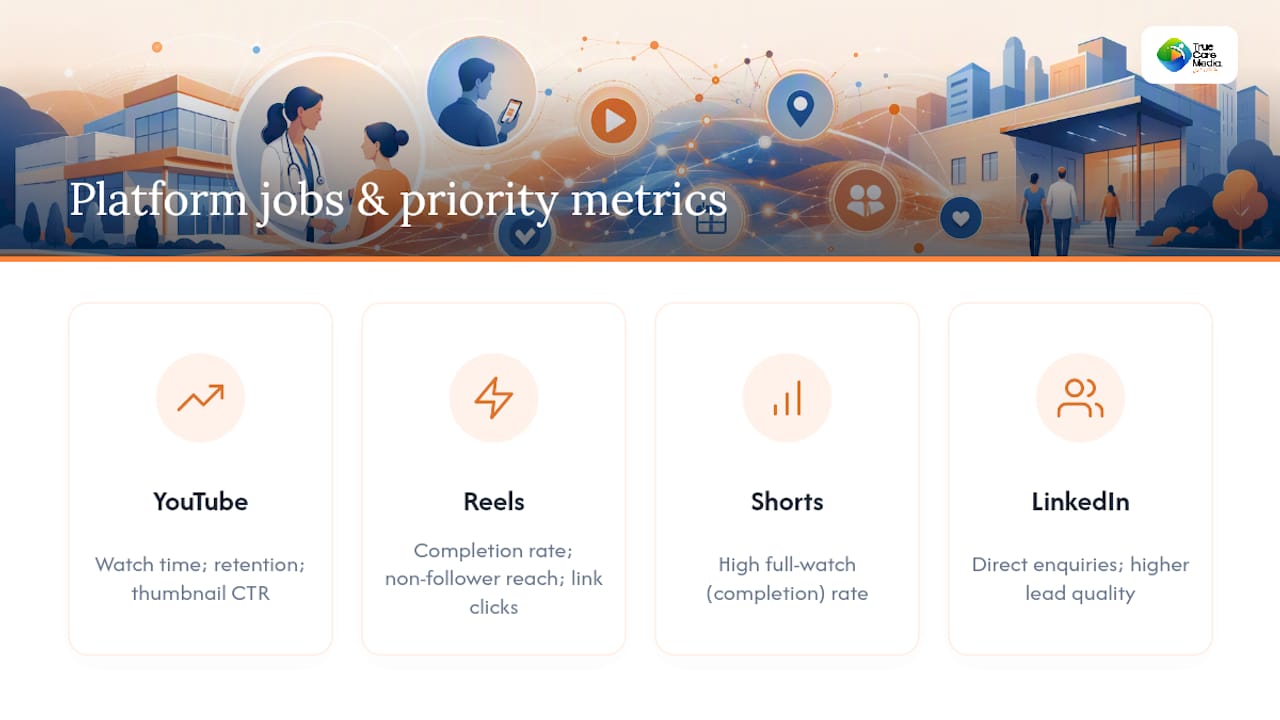
What matters on YouTube, Reels, Shorts and LinkedIn
Each platform rewards a different kind of attention, so the metric that matters on one can be irrelevant on another.
YouTube is built for depth. Watch time and average view duration drive the algorithm’s distribution decisions, and the retention curve tells you exactly where viewers drop off. Check whether traffic comes from search or from suggested videos: search traffic means people are actively looking for answers you’re providing, while suggested traffic means the platform is recommending you off the back of someone else’s content. When you run ads, thumbnail CTR and CPV become the numbers to watch first.
Meta and Instagram Reels reward completion rate and engagement rate over raw reach. Link clicks and message replies matter more than likes for a clinic, because they’re closer to an actual enquiry. Watch the split between follower reach and non-follower reach too. A Reel that only reaches existing followers isn’t doing acquisition work, no matter how good the engagement looks.
Short-form generally (Reels, Shorts, TikTok-style formats) lives and dies on completion or full-watch rate within a much shorter window than YouTube retention. A 30-second video with a 70% completion rate is performing well; comparing that figure directly against a 10-minute YouTube video’s retention curve is comparing two different sports.
LinkedIn delivers far lower volume but often better lead quality, particularly for allied health referrer relationships and B2B-style aged care partnerships. Track direct enquiries generated from LinkedIn posts specifically, because the platform’s native engagement numbers understate its actual commercial value for this audience.
Pro Tip: Before you compare platforms against each other, decide what job each one is doing. YouTube for depth and search intent, Reels for discovery, LinkedIn for referrer trust. Judging all three by the same metric is why so many clinics misjudge their own video performance.
Why paid and organic views must be reported separately
Reporting paid and organic performance as one blended number is the single most common way healthcare video metrics mislead a practice owner. A boosted post can generate thousands of views in days, but paid reach doesn’t predict organic pull, and it tells you nothing about whether the content would have found an audience on its own. Report the two separately every time, and treat any figure that mixes them as unreliable.
Here’s a practical workflow for keeping the split clean:
- Pull ad platform exports (Meta Ads Manager, YouTube ads reporting) for the exact date range and subtract those views from your total in YouTube Studio or native platform analytics.
- Tag every video link with a UTM parameter before it goes live, so Google Analytics or your CRM can attribute traffic to the specific asset, not just “social”.
- Use call tracking numbers or a dedicated intake question (“How did you hear about us?”) to capture attribution that digital tracking alone misses, particularly for phone enquiries.
- Filter organic traffic to your actual catchment geography before mapping it to CRM enquiries, since a video that performs well nationally but poorly in your service area is not doing the job you need.
Last-click attribution undervalues video specifically because most healthcare journeys involve multiple touches before someone books. A patient might watch a testimonial video in March and not enquire until June, after seeing a Google ad and reading two reviews. Multi-touch attribution, even a simple weighted model, credits the video for its actual role instead of erasing it.
Pro Tip: If your CRM has a free-text or dropdown field for enquiry source, add “saw a video” as an explicit option. It sounds basic, but most clinics never ask, so the data never exists.
Realistic benchmarks by specialty and channel maturity
Healthcare video underperforms entertainment content on raw engagement and that’s expected, not a failure. Healthcare YouTube channels post median thumbnail CTR around typical healthcare channel medians, which is well below general creator averages, but retention tends to run higher because the audience is self-selecting for genuine need rather than entertainment value.
Some working bands to calibrate against:
- Retention: for a 5 to 8 minute explainer video, median watch times of a few minutes are a solid organic result.
- Thumbnail CTR: 4.5% sits around the middle of the healthcare pack; treat anything meaningfully below that as a thumbnail or title problem, not a content problem.
- VTR: roughly 45% is a reasonable target for paid healthcare video campaigns.
- CPV: around $0.07 is a workable budgeting assumption for YouTube ads in this sector.
The number that actually matters: these bands shift by specialty and by how established your channel is. A brand-new channel should prioritise consistency of uploads before worrying about retention or CTR at all. Once you’ve published regularly for a few months, shift focus to retention and subscriber conversion, picking one or two axes to push toward the 75th or 90th percentile rather than chasing every metric at once.
Never benchmark against entertainment or lifestyle creators. Their audience relationship and content goals are different enough that the comparison actively misleads.
What to demand in a monthly video performance report
A useful report is ordered by business impact, not by what’s easiest to pull from a dashboard. The sequence should run:
- Qualified enquiries generated from video (filtered to catchment geography)
- Enquiry-to-booking conversion rate on those specific enquiries
- Subscriber conversion per 1,000 organic views, showing audience-building strength
- Organic retention metrics (average view duration, retention curve shape)
- Paid versus organic split, reported as separate figures, never blended
- Traffic source breakdown (search, suggested, direct, social referral)
- Catchment geography, confirming the audience is actually who you’re trying to reach
Views belong in an appendix, if anywhere. A sample report row might read: “NDIS Intake Explainer, 3 minutes 40 seconds, organic retention 58%, 4 qualified enquiries, 1 booking. Action: keep, re-promote to catchment audience.” Another might read: “Team Introduction Reel, high paid views, near-zero organic pull, zero enquiries. Action: kill or debrief.”
Four questions worth asking any agency or in-house team every month:
- What percentage of these views were paid versus organic?
- What does the retention curve look like, not just the average?
- How many qualified enquiries trace directly to this video via UTM or intake data?
- Which videos are you recommending we kill, keep, re-optimise or promote further, and why?
If the answers come back vague, that’s the report telling you something too.
Privacy and compliance considerations for healthcare video
Australian clinics aren’t bound by the US Health Insurance Portability and Accountability Act (HIPAA), but the underlying principle, protecting identifiable patient health information, applies just as firmly under Australian privacy law and the Privacy Act’s Australian Privacy Principles. Filming a patient testimonial or before-and-after sequence means securing explicit, informed written consent that specifies exactly where the footage will be used and for how long.
Metrics tracking adds a second layer most clinics overlook. UTM parameters, retargeting pixels and analytics scripts embedded in video landing pages can inadvertently create identifiable data trails if a viewer’s engagement with a condition-specific video (say, a dementia care explainer or an NDIS-specific service page) gets tied to their identity through form fills or ad retargeting. Keep analytics tracking aggregated and anonymised wherever a video touches a sensitive health category.
Distribution planning matters as much as filming consent. Posting condition-specific content to broad social feeds risks exposing more about a patient’s circumstances than they agreed to when they signed a release form. A structured distribution plan that keeps protected health information off public social channels while still measuring performance properly gives you a way to track outcomes without compromising anyone’s privacy. Build consent review and distribution scope into your video briefing process from the outset, not as an afterthought once footage is already shot.
Reading comments, shares and patient sentiment properly
Numbers tell you what happened; comments and shares tell you why. A video with modest view counts but a thread of genuine, specific comments (“This explained exactly what I needed before my first appointment”) is doing more commercial work than a video with ten times the views and no engagement at all.
Shares carry particular weight in healthcare because people rarely share health content casually. A share usually means someone found the video useful enough to send to a specific person facing a specific situation, a family member weighing aged care options, a friend newly diagnosed. That’s a much stronger trust signal than a like.
Read comment sentiment qualitatively rather than just counting comments. Look for:
- Specific questions repeated across multiple videos, which flag gaps your content isn’t yet addressing.
- Recognition language (“this is exactly what happened to us”), which signals the content is resonating with real lived experience.
- Confusion or pushback, which often means a video oversimplified something clinically important.
Where a comment references identifiable personal health details, moderate it promptly rather than leaving it visible, both for the commenter’s privacy and to keep the thread useful for other viewers. Feed this qualitative read into your monthly reporting alongside the numbers, because a spike in one specific type of comment often predicts which video topic to make next.
Connecting video metrics to acquisition and retention
Video metrics only matter if they connect to the two numbers a practice owner actually cares about: new patient acquisition and existing patient retention. The link runs through your CRM, not through platform analytics alone.
For acquisition, map every qualified enquiry back to its first video touchpoint using UTM data and intake-question responses, then track that enquiry through to a booked appointment. This is the enquiry-to-booking conversion figure that belongs at the top of your dashboard. Over several months, patterns emerge: certain video topics or formats consistently produce higher-converting enquiries, even if their raw view counts are unremarkable.
For retention, the connection is less direct but still measurable. Existing patients who watch educational or preparation videos before a procedure or service tend to show up better informed and more confident, which shows up downstream in things like reduced no-shows and stronger reviews and referral behaviour. Track whether patients who engage with your video content before an appointment behave differently from those who don’t, using simple tagging in your booking system.
The broader point: video shouldn’t sit in a marketing silo with its own separate metrics nobody else looks at. It should feed the same acquisition funnel and retention dashboard your practice already tracks, just with video-specific data layered in as one contributing channel among several.
Running A/B tests on healthcare video content
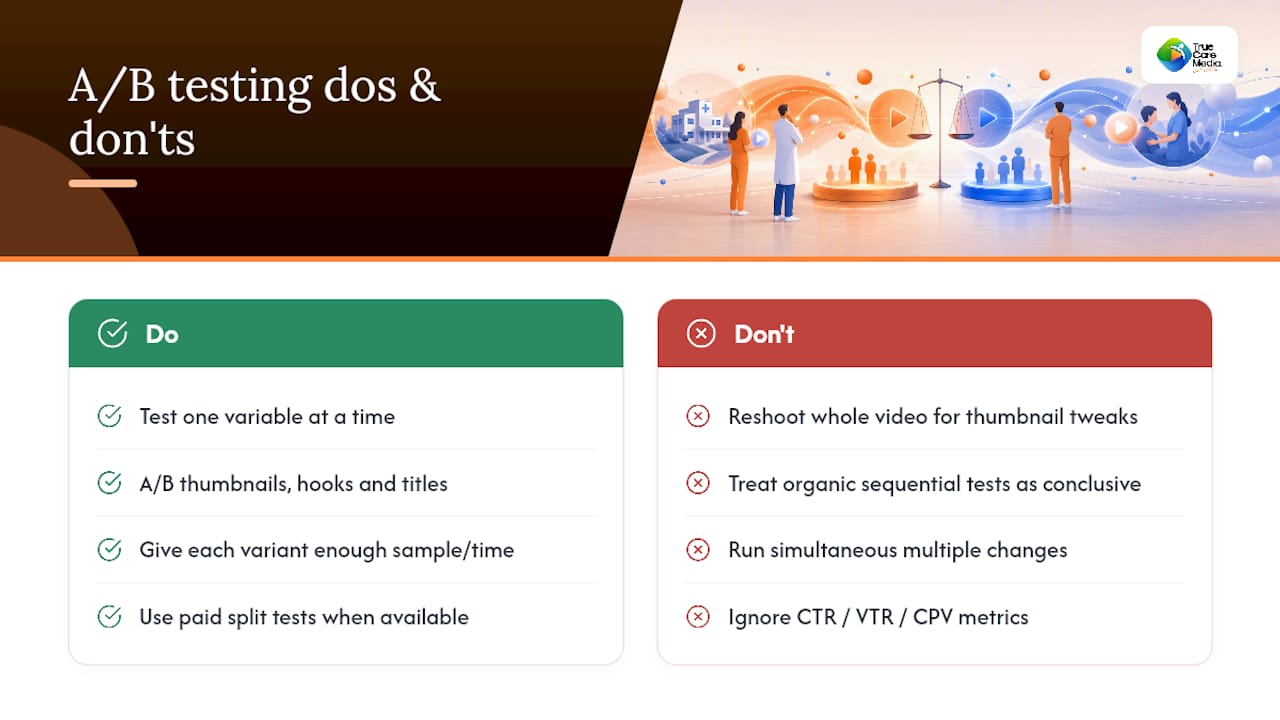
A/B testing in healthcare video works best on the elements viewers decide on fastest: thumbnails, opening hooks and titles. Because most platforms show the thumbnail and title before anything else, small changes here often move CTR more than reshooting an entire video.
Run one variable at a time. Test two thumbnail options for the same video, holding everything else constant, and give each version enough time or spend to reach a meaningful sample before calling a winner. For organic content, that might mean alternating thumbnail styles across a run of similar videos rather than split-testing a single upload, since most platforms don’t natively A/B test organic thumbnails.
Opening hooks matter enormously for retention. Test whether starting with a patient outcome statement (“Sarah walked into her first appointment nervous, here’s what changed”) outperforms starting with a clinical explanation of the service itself. The retention curve in the first fifteen seconds will show you the answer clearly.
For paid campaigns, most ad platforms support proper split testing natively, letting you compare CPV, VTR and CTR across variants with statistical confidence. For organic content, be honest about the limits: you’re comparing sequential uploads, not simultaneous variants, so seasonal timing and algorithm shifts will muddy your results. Treat organic testing as directional guidance, not a controlled experiment.
Test title framing too. A title that leads with a condition name often performs differently to one that leads with an outcome or reassurance, and the gap can be sizeable enough to change which approach you use as your default going forward.
Where healthcare video metrics interpretation goes wrong
The most common mistake is treating a view count as a success metric on its own, without checking whether those views were paid, organic, or even relevant to your catchment area. A video can rack up ten thousand views from an entirely different state and produce zero bookings, while a quieter video with three hundred views in your own suburb generates five genuine enquiries.
A second mistake is judging every video against the same benchmark regardless of length or format. A 15-second Reel and a 12-minute YouTube explainer are not comparable on retention percentage, and forcing that comparison leads to killing content that’s actually working within its own format’s norms.
Third, clinics often confuse correlation with causation when a video and a booking spike happen close together. Without UTM tagging or intake attribution, you’re guessing at a connection that might actually be seasonal demand, a referral pattern, or a completely unrelated marketing push landing at the same time.
Fourth, retention curves get read too simplistically. A slow, steady decline across a video isn’t automatically bad; it might reflect natural attention drift on a genuinely useful long-form piece. A sharp cliff at the five to ten second mark is the pattern that actually demands action, because it usually means the opening hook failed to earn the next ten seconds.
Finally, plenty of clinics stop measuring after the first month, missing the compounding organic pull that well-made educational content builds over six to twelve months, long after the initial promotional push has faded.
How digital-first clinics should brief for measurable video
The shift that matters isn’t a new metric, it’s ranking outcome metrics above vanity ones on the same dashboard you already use. In practice that means UTM discipline from the first link you publish, a distribution plan that keeps protected health information off public social feeds, and a retention focus baked into scripting, not bolted on afterwards.
Briefing a production partner changes too: specify the enquiry you want, not just the concept.
— Mishal
How Com builds video you can actually measure
An alternative to briefing a video purely on concept and hoping the numbers work out afterwards. Every project starts with the outcome metric being chased, for example qualified enquiries or bookings, and the distribution and tracking plan is built around that goal from the first conversation.

This includes UTM tagging built into every link before launch, a distribution plan designed to protect patient information, and content briefed around retention and conversion rather than raw reach. If you’re weighing up how video fits your acquisition and retention numbers, our guide on the role of video in aged care marketing walks through how that plays out for residential and home care providers specifically. Get in touch to talk through what a measurable video brief looks like for your organisation.
Sources
Benchmarks and guidance in this article draw on Healthcare Advertising Statistics for Clinics in 2026, Measuring the ROI of Hospital Video Marketing, and Healthcare YouTube benchmarks: what ‘good’ actually looks like. For a home care perspective on video, see Kells Domiciliary Care’s video tips.
- Healthcare Advertising Statistics for Clinics in 2026